Birth of a Cliche
We’ve all heard the phrase “Shift Left” applied to just about everything in our business, from security testing to ordering lunch. You may share my perception that it’s become a bit of a cliche, that people regard “Shift left is a ‘good idea’ because it’s more expensive to fix things after they’re in production” as obviously self-evident. But we lack any real understanding of the underlying process dynamics, and consequently fail to apply concerted effort to implement these ideas beyond buzz-wordy lip-service in hiring adverts.
In what follows, I hope you take away a fundamental understanding of why you should devote serious attention, engineering resources, and product management practices to your software production pipeline as a critical value-stream within your business.
To achieve that understanding, we’re going to walk through a thought experiment revolving around two hypothetical almost-identical teams. We’ll take a look at their development process and how (and when) they gain confidence in their code. By understanding the implications of their process, we’ll also understand the implications of our own processes, and more importantly, understand what we need to do to achieve significant gains in developer productivity.
Thought Experiment
In order to gain a deeper understanding of why “Shift Left” can improve your development process, we are going to make some simplifying assumptions in our thought experiment. These assumptions hopefully don’t detract from the fundamental principles we are trying to illustrate, but you can be the judge. Each team is different, so in order to make this relevant to everyone, we are going to hypothesize two different teams that are fundamentally the same, except for a few work-processes.
Both teams have a 10-step process for developing and deploying the changes necessary to deliver a Story idea into production. In our experiment, we are interested in how confidence in the code affects delivery efficiency, so we control for all other variables. Each step in the process takes the same amount of time/effort, but provides varying levels of confidence in the software change.
We assume that Team A, which we will call (in a curious bit of foreshadowing) the Slow Team, and Team B, which we will call the Fast Team, are subject to identical external factors, such as Story quality, ACs, CFRs, security requirements, etc. For each team, we can measure the Total Confidence they have in their code change as they complete each stage of their development process, from writing code, testing locally, testing in a dev environment, testing in QA, load testing, architecture review, security review, performance testing, UAT, and so on into production.
For the purposes of our analysis, we will assume that during the development process some error is discovered that causes the team to start over, i.e. go back to Step 1 (writing code) and go through the process again, but only once.
The Slow Team
A graph of the Slow Team’s current state might look like Figure 0 (inspired by some slides from Tim Cochran’s presentation at QCon https://www.infoq.com/presentations/thoughtworks-high-performance-teams/):
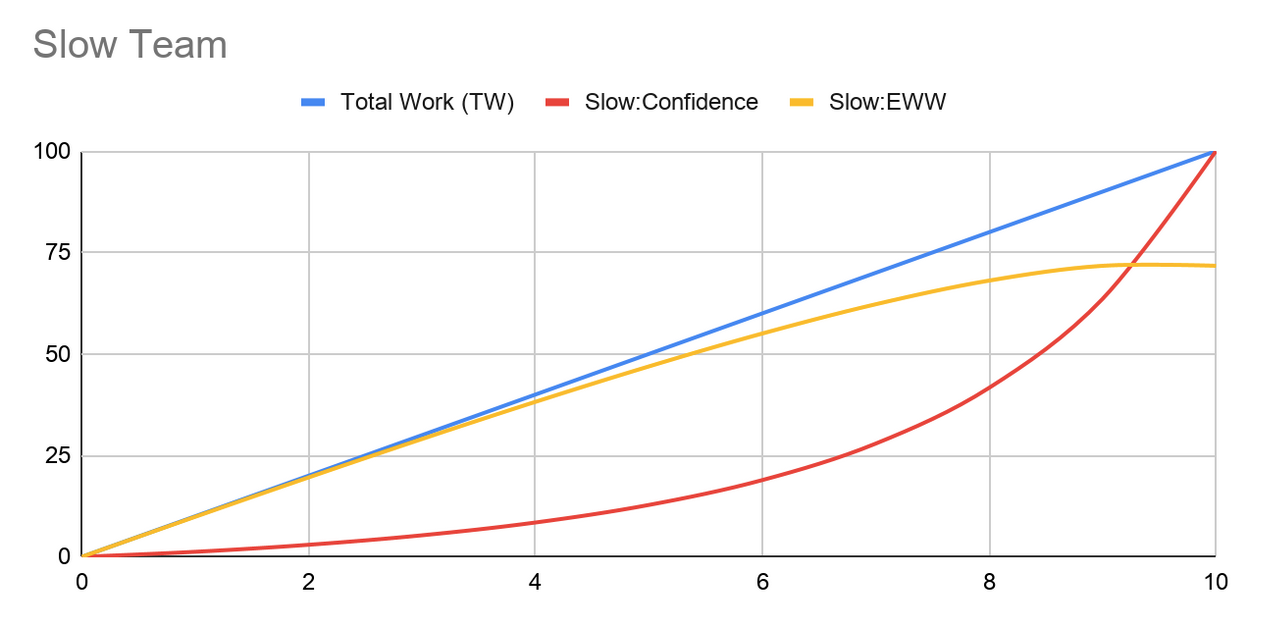
Figure 0: Slow Team Confidence Curve and Expected Wasted Work
Some explanation:
The blue line is the normalized Total Work (TW) being done under happy path conditions (i.e. everything goes perfectly). Recall that we simplified our hypothetical situation by stating that each stage in the process takes the same amount of time/effort, so our work completion rate is linear.
The red line is the Confidence level that the team gains in the changes at each stage of the development process. You can see that the confidence doesn’t really grow until the later stages of the process.
This may reflect a team’s mistrust of making it past an architecture or security review, perhaps those processes are highly subjective. This may be indicative of a team that has an inverted testing pyramid. For example, one which doesn’t really start gaining confidence until a massive number of integration and E2E tests have been completed successfully. This may also be indicative of a team which has a lot of flaky tests, leading the developers to mistrust the results. It doesn’t really matter what the particular reason is, it is only important to acknowledge and agree that this type of Confidence curve is all too common in our organizations.
The yellow line shows the Expected Wasted Work (EWW) at each stage of the development process, which is computed as the TW * Probability of Error.
Since Probability of error is really just (100 - Confidence%), we see that EWW = TW * (100 - Confidence).
Regardless of the cause of any particular error, we can look at the cumulative effect on the Expected Total Work (ETW) to be done by the team.
Recall that we assume one error forcing us to go back to the coding stage, so we can compute ETW = TW + EWW
For our comparisons, we are normalizing the cost of what we might consider the “happy path” estimate of making the change. In other words, if everything went perfectly, the change would cost 100% of some TW amount of work.
Using these assumptions, we compute Expected Total Work to be 172% of the estimated “happy path” cost of completion.
The Fast Team
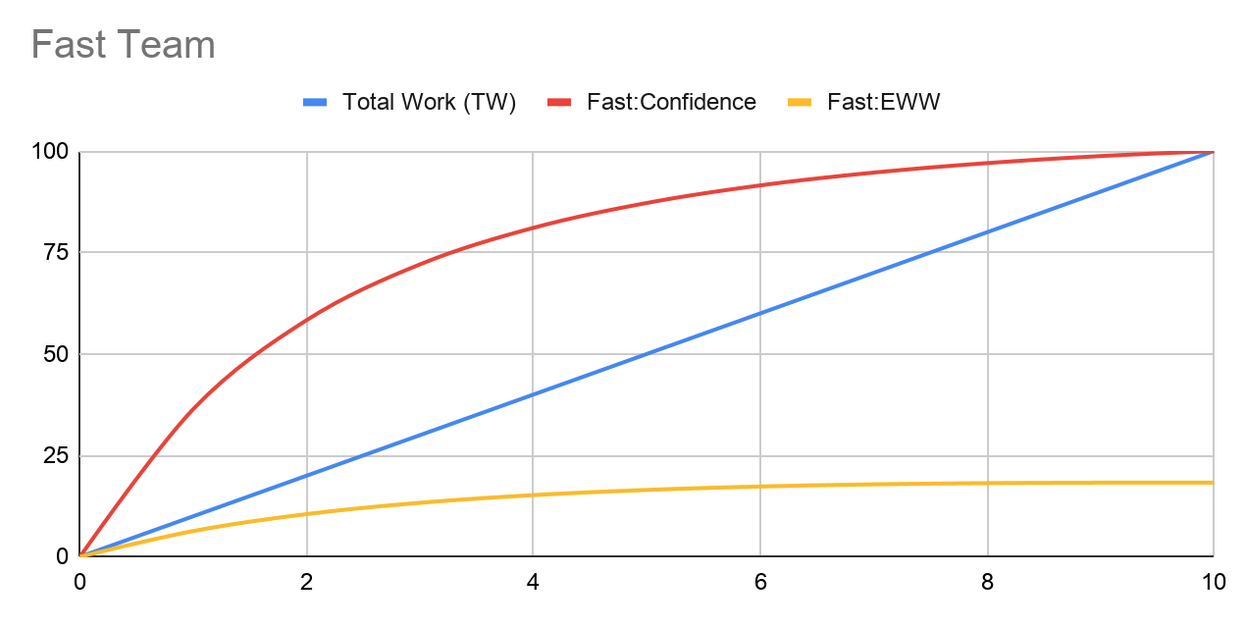
Figure 1: Fast Team Confidence Curve and Expected Wasted Work
The blue line is the normalized Total Work (TW) being done under happy path conditions, the red line is the team’s confidence probability level at each stage of the development process, and the yellow line is the resulting Expected Wasted Work.
The main difference is that Fast Team has ordered and structured their development process to pull all the activities that raise confidence the most as early in their process as possible.
Some examples of these activities might be:
- Automating security checks into the build process
- Implementing a healthy testing pyramid, with high-coverage fast-running unit tests
- Implementing contract testing
- Implementing architectural fitness functions
In effect, this team has “Shifted Left” the processes and activities that yield the highest level of confidence in their code changes.
Computing the ETW for Fast Team yields a value of 118% of the estimated “happy path” cost of making the change. This means that Fast Team is about 45% faster than Slow Team.
Think about what kinds of efficiency gains you can achieve just by reorganizing your development process.
Enter SRE Principles
Note that in the above scenario, we have determined that we will only deploy code to production when we are 100% confident that it will work. We saw that just reorganizing our development process to play the odds of rework differently resulted in a 45% efficiency improvement.
What happens with our teams when we adopt SRE principals? Specifically, we want to think about the ideas of a downtime budget, and the effect that has on our team velocity.
Again, we are going to make some simplifying assumptions to make this easier to analyze. Specifically, we are going to assume that we have CI/CD processes in place that allow us to roll back any change that is made quickly, and we have effective monitoring solutions in place that allow us to detect when we need to roll back.
Given that environment, we can translate our downtime budget into a change failure rate, and once we have a change failure rate, we can determine the equivalent confidence level necessary to achieve the required change failure rate over time. (We are relying on the normal SRE downtime budget governance to tighten or relax our required confidence level over time).
Said differently, we have just lowered our Confidence requirement to get into production to some X < 100%. This means that we now have shortened our development process. We no longer have to do —whatever— to get from X% confident to 100% confident. What does this mean?
Figure 2 shows the graph illustrating the analysis:
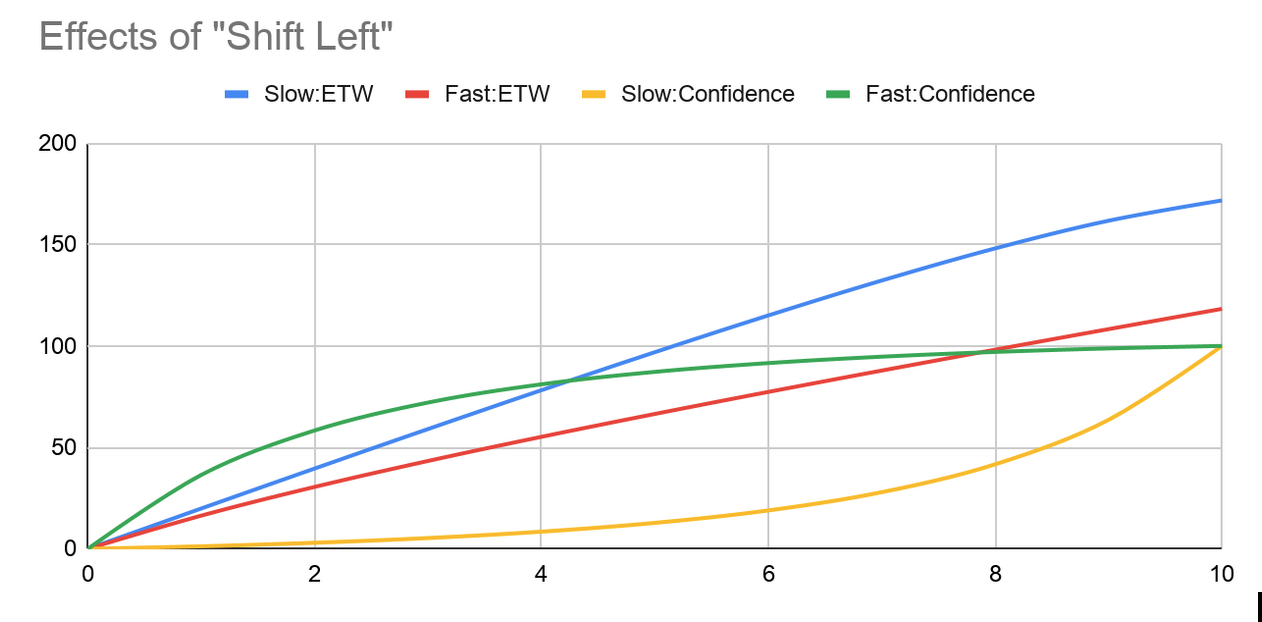
Figure 2: Comparison of Expected Total Work
The blue line represents the Expected Total Work (ETW) for the Slow Team. The red line represents the ETW for the Fast Team. The yellow line represents the Confidence level for the Slow Team, and the green line represents the Confidence level for the Fast Team.
Let’s use a concrete example. We define our allowable downtime budget as 5 minutes per month per customer. We assume we have a CI/CD deployment pipeline and monitoring that can detect a failure and rollback within one minute, which means we can have 5 failures per person. Within our CI/CD pipeline we have implemented a canary deployment process which will deploy and enable a change for 1% of our customer base (and we have a customer base sufficiently large where 1% of traffic is enough to provide us confidence in software quality). This means that we can suffer 500 deployment failures per month and still remain within our downtime budget.
Let’s further assume that we have 100 developers deploying code twice per day, which gives us a total of 4000 deployments per month.
This gives us a target failure rate of 12.5%.
In practical terms, this failure rate translates to a Confidence level of 87.5%, but we can overachieve a bit and round up to a 90% Confidence level requirement.
What does that mean? To answer that, we just look at the Confidence curves and note how much Expected Total Work each team does to get to the 90% level. At that point, the team can release to production.
Note that the Slow Team essentially needs to complete 100% of the process, which corresponds to an ETW of 172%, because of the shape of their curve, and how late in their process they achieve high levels of confidence (recall the initial assumptions, where we discover a flaw in each change that forces us to start over). The Fast Team, on the other hand, achieves 90% confidence about 60% of the way through, which corresponds to an ETW around 75%. Under these conditions, our Fast Team is about 2.2x faster than Slow Team.
TANSTAAFL
Having said that, it’s super important to realize that “There ain’t no such thing as a free lunch.” Even for the Fast Team, the remaining 55% of ETW to achieve 100% confidence is still important and extremely necessary to maintain the quality of the codebase. It’s just no longer on the critical path to production, and can be accomplished in a cost-effective manner.
It’s critical to note, if you don’t continue to do everything you can to maintain 100% confidence in your codebase, you will soon find yourself in a world of hurt.
Death of a Cliche
I’m going to ask you to forget the numbers now. They’re meaningless in and of themselves because they are built on mythical teams and assumptions that don’t pertain to your particular situation. They are only useful in comparing two different scenarios, and getting a feel for what a team can achieve by organizing their work process in such a way to get higher confidence levels as early in the process as possible. And perhaps more importantly, understanding “why” we can achieve higher productivity by doing so.
And in case you’re thinking our hypothetical team comparison was a contrived example and the 2.2x differential is unrealistic, I would agree that it’s a super conservative number (you read that correctly, I said conservative).
If you’re currently working in an environment where E2E testing takes multiple days, or your deployments are stuck behind an outsourced manual testing process, or you have a runbook defining the manual steps to build, package, and deploy your software with a Change Review Board that needs a manual checkpoint review three times along the way, then your potential gain could be orders of magnitude greater. Just look at the DORA Report to see what is achievable.
What does “Shift Left” really mean?
“Shift Left” is just shorthand for recognizing that your development process and pipeline to production is a critical value-stream for delivering value to the business. It means optimizing your development process to bring forward the activities that provide the greatest Incremental Confidence in the least amount of time, so that we can reduce the chances of rework as quickly as possible and therefore increase team velocity and accelerate the delivery of business value.
Understanding these fundamental principles will enable you to more easily justify investments in changing your work process. We know what kinds of development processes will help:
- Healthy automated efficient Test Pyramid (unit, function, contract, integration, E2E, UX)
- Infrastructure-as-code
- CI/CD pipelines, with rollback
- System monitoring and failure detection
- Security testing “shifted left”
- Architecture fitness functions “shifted left”
Some of the work necessary may be expensive to do, or it may take time to realize the full payoff. But OMG what a payoff! Imagine approaching your C-Suite with the statement “If you give me half of our development staff to work on our development process, I can double our velocity.” If that’s too daunting, then work on these value-stream improvements within your team. No matter which organizational scale you’re working at, it’s like magically hiring a whole duplicate staff, without the painful hiring and onboarding process.
My advice to you, take a hard look at your process. If you don’t have metrics for failure rates at each stage, set them up, and guess at them in the meantime. Figure out which changes yield the most improvement in Confidence level, because that will lead you to the highest acceleration of business value. Just make sure that you’re achieving the increased confidence on a time scale that still maintains a tight feedback cycle for your developers, otherwise you may not achieve the gains you anticipate because you’re interrupting their “flow” with longer and longer build/test/code cycles.
In other words, use your product management skills to optimize the value-stream for your pipeline to production, do whatever you can to derive business value from it, and make sure you’re tracking your metrics and using them to inform your next steps. Your developers will thank you, and so will your leadership.
Acknowledgements
Thanks to JK Werner, Matt Foster, Mike Mason, and Dan Kunnath for pointing out significant ways to make this article stronger and more relevant. I claim responsibility for all remaining flaws.